1. Features
Sleuth sets up instrumentation not only to track timing, but also to catch
errors so that they can be analyzed or correlated with logs. This works the
same way regardless of if the error came from a common instrumented library,
such as RestTemplate, or your own code annotated with @NewSpan or similar.
Below, we’ll use the word Zipkin to describe the tracing system, and include Zipkin screenshots. However, most services accepting Zipkin’s format[zipkin.io/zipkin-api/#/default/post_spans], have similar base features. Sleuth can also be configured to send data in other formats, something detailed later.
1.1. Contextualizing errors
Without distributed tracing, it can be difficult to understand the impact of a an exception. For example, it can be hard to know if a specific request caused the caller to fail or not.
Zipkin reduces time in triage by contextualizing errors and delays.
Requests colored red in the search screen failed:
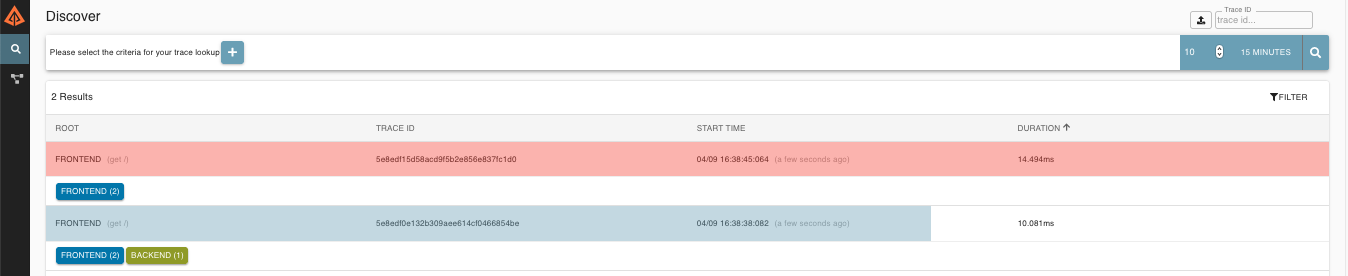
If you then click on one of the traces, you can understand if the failure happened before the request hit another service or not:
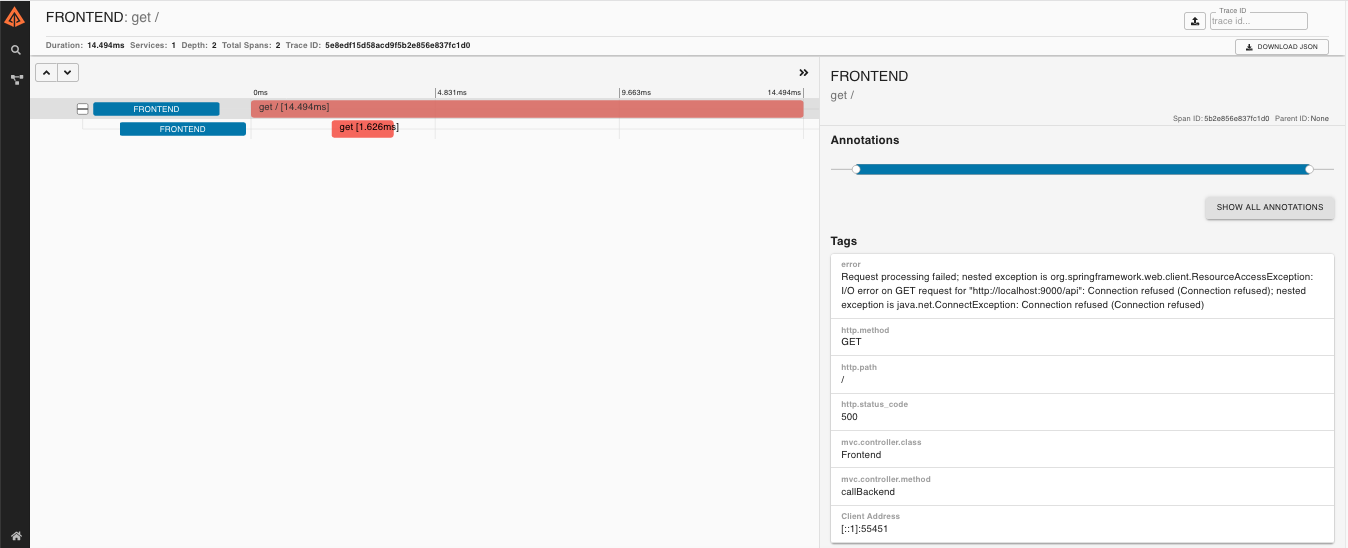
For example, the above error happened in the "backend" service, and caused the "frontend" service to fail.
1.2. Log correlation
Sleuth configures the logging context with variables including the service name
(%{spring.zipkin.service.name}) and the trace ID (%{traceId}). These help
you connect logs with distributed traces and allow you choice in what tools you
use to troubleshoot your services.
Once you find any log with an error, you can look for the trace ID in the message. Paste that into Zipkin to visualize the entire trace, regardless of how many services the first request ended up hitting.
backend.log:  2020-04-09 17:45:40.516 ERROR [backend,5e8eeec48b08e26882aba313eb08f0a4,dcc1df555b5777b3,true] 97203 --- [nio-9000-exec-1] o.s.c.s.i.web.ExceptionLoggingFilter     : Uncaught exception thrown
frontend.log:2020-04-09 17:45:40.574 ERROR [frontend,5e8eeec48b08e26882aba313eb08f0a4,82aba313eb08f0a4,true] 97192 --- [nio-8081-exec-2] o.s.c.s.i.web.ExceptionLoggingFilter     : Uncaught exception thrown
Above, you’ll notice the trace ID is 5e8eeec48b08e26882aba313eb08f0a4, for
example. This log configuration was automatically setup by Sleuth.
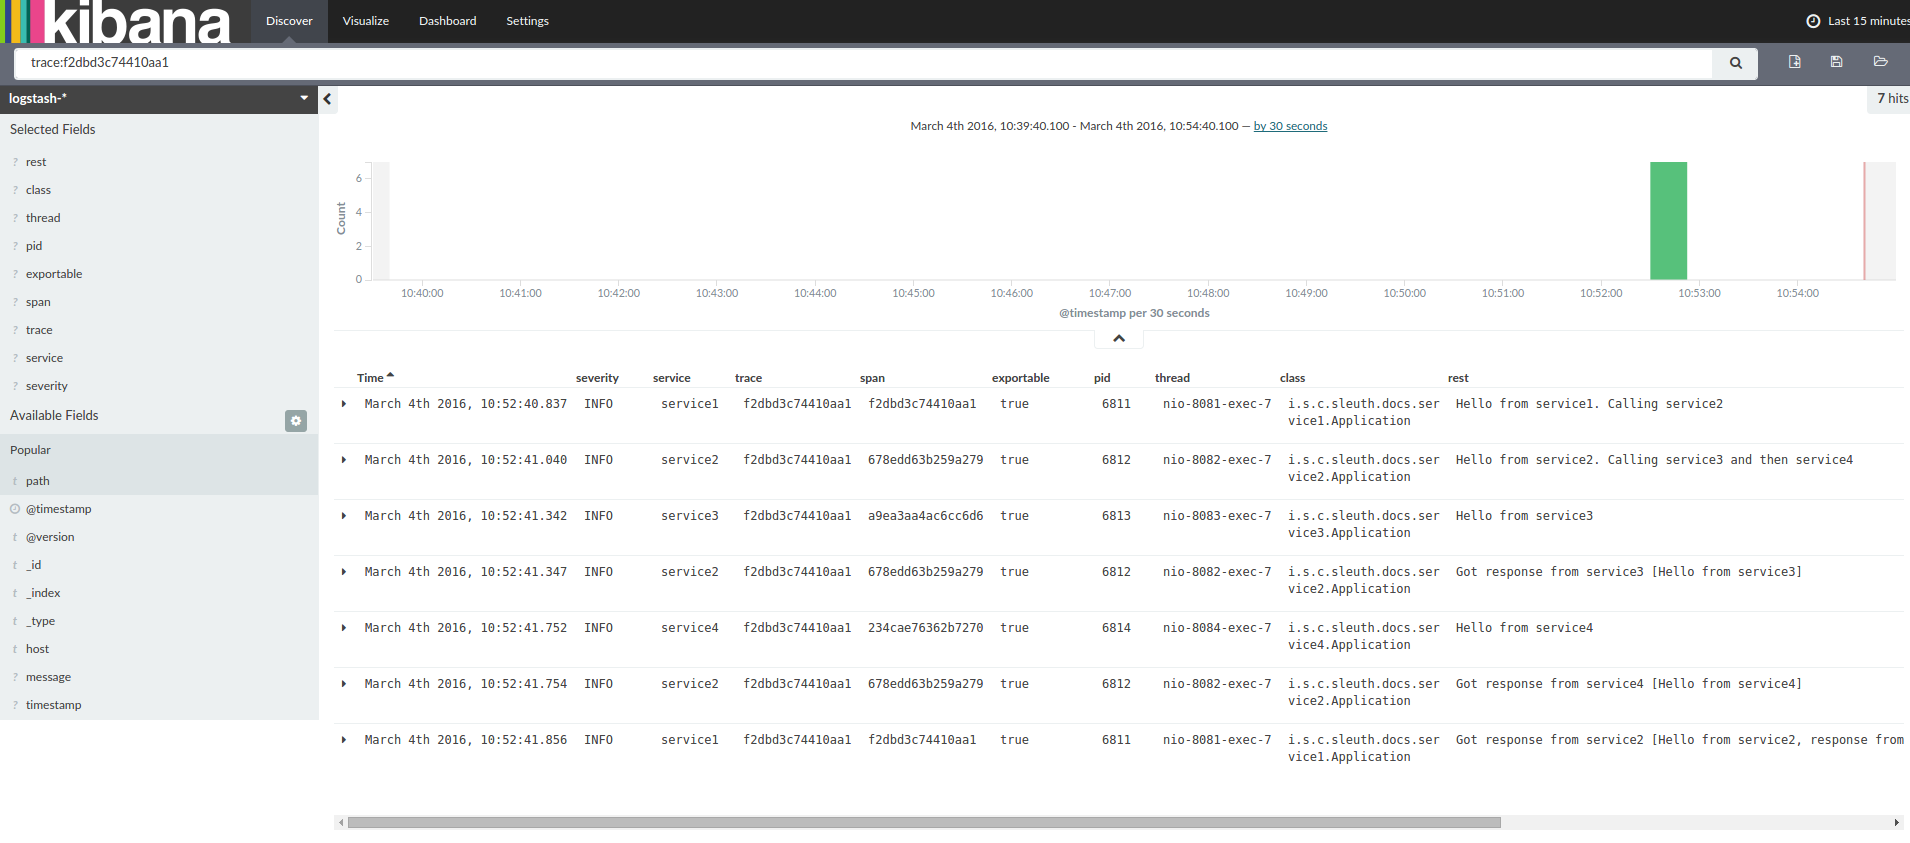
If you use a log aggregating tool (such as Kibana, Splunk, and others), you can order the events that took place. An example from Kibana would resemble the following image:
If you want to use Logstash, the following listing shows the Grok pattern for Logstash:
filter {
  # pattern matching logback pattern
  grok {
    match => { "message" => "%{TIMESTAMP_ISO8601:timestamp}\s+%{LOGLEVEL:severity}\s+\[%{DATA:service},%{DATA:trace},%{DATA:span}\]\s+%{DATA:pid}\s+---\s+\[%{DATA:thread}\]\s+%{DATA:class}\s+:\s+%{GREEDYDATA:rest}" }
  }
  date {
    match => ["timestamp", "ISO8601"]
  }
  mutate {
    remove_field => ["timestamp"]
  }
}| If you want to use Grok together with the logs from Cloud Foundry, you have to use the following pattern: |
filter {
  # pattern matching logback pattern
  grok {
    match => { "message" => "(?m)OUT\s+%{TIMESTAMP_ISO8601:timestamp}\s+%{LOGLEVEL:severity}\s+\[%{DATA:service},%{DATA:trace},%{DATA:span}\]\s+%{DATA:pid}\s+---\s+\[%{DATA:thread}\]\s+%{DATA:class}\s+:\s+%{GREEDYDATA:rest}" }
  }
  date {
    match => ["timestamp", "ISO8601"]
  }
  mutate {
    remove_field => ["timestamp"]
  }
}
JSON Logback with Logstash
Often, you do not want to store your logs in a text file but in a JSON file that Logstash can immediately pick.
To do so, you have to do the following (for readability, we pass the dependencies in the groupId:artifactId:version notation).
Dependencies Setup
-
Ensure that Logback is on the classpath (
ch.qos.logback:logback-core). -
Add Logstash Logback encode. For example, to use version
4.6, addnet.logstash.logback:logstash-logback-encoder:4.6.
Logback Setup
Consider the following example of a Logback configuration file (named logback-spring.xml).
<?xml version="1.0" encoding="UTF-8"?>
<configuration>
<include resource="org/springframework/boot/logging/logback/defaults.xml"/>
<springProperty scope="context" name="springAppName" source="spring.application.name"/>
<!-- Example for logging into the build folder of your project -->
<property name="LOG_FILE" value="${BUILD_FOLDER:-build}/${springAppName}"/>
<!-- You can override this to have a custom pattern -->
<property name="CONSOLE_LOG_PATTERN"
value="%clr(%d{yyyy-MM-dd HH:mm:ss.SSS}){faint} %clr(${LOG_LEVEL_PATTERN:-%5p}) %clr(${PID:- }){magenta} %clr(---){faint} %clr([%15.15t]){faint} %clr(%-40.40logger{39}){cyan} %clr(:){faint} %m%n${LOG_EXCEPTION_CONVERSION_WORD:-%wEx}"/>
<!-- Appender to log to console -->
<appender name="console" class="ch.qos.logback.core.ConsoleAppender">
<filter class="ch.qos.logback.classic.filter.ThresholdFilter">
<!-- Minimum logging level to be presented in the console logs-->
<level>DEBUG</level>
</filter>
<encoder>
<pattern>${CONSOLE_LOG_PATTERN}</pattern>
<charset>utf8</charset>
</encoder>
</appender>
<!-- Appender to log to file -->
<appender name="flatfile" class="ch.qos.logback.core.rolling.RollingFileAppender">
<file>${LOG_FILE}</file>
<rollingPolicy class="ch.qos.logback.core.rolling.TimeBasedRollingPolicy">
<fileNamePattern>${LOG_FILE}.%d{yyyy-MM-dd}.gz</fileNamePattern>
<maxHistory>7</maxHistory>
</rollingPolicy>
<encoder>
<pattern>${CONSOLE_LOG_PATTERN}</pattern>
<charset>utf8</charset>
</encoder>
</appender>
<!-- Appender to log to file in a JSON format -->
<appender name="logstash" class="ch.qos.logback.core.rolling.RollingFileAppender">
<file>${LOG_FILE}.json</file>
<rollingPolicy class="ch.qos.logback.core.rolling.TimeBasedRollingPolicy">
<fileNamePattern>${LOG_FILE}.json.%d{yyyy-MM-dd}.gz</fileNamePattern>
<maxHistory>7</maxHistory>
</rollingPolicy>
<encoder class="net.logstash.logback.encoder.LoggingEventCompositeJsonEncoder">
<providers>
<timestamp>
<timeZone>UTC</timeZone>
</timestamp>
<pattern>
<pattern>
{
"severity": "%level",
"service": "${springAppName:-}",
"trace": "%X{X-B3-TraceId:-}",
"span": "%X{X-B3-SpanId:-}",
"parent": "%X{X-B3-ParentSpanId:-}",
"exportable": "%X{X-Span-Export:-}",
"baggage": "%X{key:-}",
"pid": "${PID:-}",
"thread": "%thread",
"class": "%logger{40}",
"rest": "%message"
}
</pattern>
</pattern>
</providers>
</encoder>
</appender>
<root level="INFO">
<appender-ref ref="console"/>
<!-- uncomment this to have also JSON logs -->
<!--<appender-ref ref="logstash"/>-->
<!--<appender-ref ref="flatfile"/>-->
</root>
</configuration>That Logback configuration file:
-
Logs information from the application in a JSON format to a
build/${spring.application.name}.jsonfile. -
Has commented out two additional appenders: console and standard log file.
-
Has the same logging pattern as the one presented in the previous section.
If you use a custom logback-spring.xml, you must pass the spring.application.name in the bootstrap rather than the application property file.
Otherwise, your custom logback file does not properly read the property.
|
1.3. Service Dependency Graph
When you consider distributed tracing tracks requests, it makes sense that trace data can paint a picture of your architecture.
Zipkin includes a tool to build service dependency diagrams from traces, including the count of calls and how many errors exist.
The example application will make a simple diagram like this, but your real environment diagram may be more complex. image::https://raw.githubusercontent.com/spring-cloud/spring-cloud-sleuth/master/docs/src/main/asciidoc/images/zipkin-depedendencies.png[Zipkin Dependencies]
Note: Production environments will generate a lot of data. You will likely need to run a separate service to aggregate the dependency graph. You can learn more here.
1.4. Request scoped properties (Baggage)
Distributed tracing works by propagating fields inside and across services that connect the trace together: traceId and spanId notably. The context that holds these fields can optionally push other fields that need to be consistent regardless of many services are touched. The simple name for these extra fields is "Baggage".
Sleuth allows you to define which baggage are permitted to exist in the trace context, including what header names are used.
The following example shows setting baggage values:
Span initialSpan = this.tracer.nextSpan().name("span").start();
BUSINESS_PROCESS.updateValue(initialSpan.context(), "ALM");
COUNTRY_CODE.updateValue(initialSpan.context(), "FO");| There is currently no limitation of the count or size of baggage items. Keep in mind that too many can decrease system throughput or increase RPC latency. In extreme cases, too much baggage can crash the application, due to exceeding transport-level message or header capacity. |
Baggage versus Tags
Like trace IDs, Baggage is attached to messages or requests, usually as headers. Tags are key value pairs sent in a Span to Zipkin. Baggage values are not added spans by default, which means you can’t search based on Baggage unless you opt-in.
To make baggage also tags, use the property spring.sleuth.baggage.tag-fields
like so:
spring:
  sleuth:
    baggage:
      remoteFields:
        - country-code
        - x-vcap-request-id
      tagFields:
        - country-code