Table of Contents
- 1. Introduction
- 2. Additional resources
- 3. Features
- 4. Sampling
- 5. Propagation
- 6. Current Tracing Component
- 7. Current Span
- 8. Instrumentation
- 9. Span lifecycle
- 10. Naming spans
- 11. Managing spans with annotations
- 12. Customizations
- 13. Sending spans to Zipkin
- 14. Zipkin Stream Span Consumer
- 15. Integrations
- 16. Running examples
Spring Cloud Sleuth implements a distributed tracing solution for Spring Cloud.
Spring Cloud Sleuth borrows Dapper’s terminology.
Span: The basic unit of work. For example, sending an RPC is a new span, as is sending a response to an RPC. Span’s are identified by a unique 64-bit ID for the span and another 64-bit ID for the trace the span is a part of. Spans also have other data, such as descriptions, timestamped events, key-value annotations (tags), the ID of the span that caused them, and process ID’s (normally IP address).
Spans are started and stopped, and they keep track of their timing information. Once you create a span, you must stop it at some point in the future.
![[Tip]](images/tip.png) | Tip |
|---|---|
The initial span that starts a trace is called a |
Trace: A set of spans forming a tree-like structure. For example, if you are running a distributed big-data store, a trace might be formed by a put request.
Annotation: is used to record existence of an event in time. With Brave instrumentation we no longer need to set special events for Zipkin to understand who the client and server are and where the request started and where it has ended. For learning purposes however we will mark these events to highlight what kind of an action took place.
- cs - Client Sent - The client has made a request. This annotation depicts the start of the span.
- sr - Server Received - The server side got the request and will start processing it. If one subtracts the cs timestamp from this timestamp one will receive the network latency.
- ss - Server Sent - Annotated upon completion of request processing (when the response got sent back to the client). If one subtracts the sr timestamp from this timestamp one will receive the time needed by the server side to process the request.
- cr - Client Received - Signifies the end of the span. The client has successfully received the response from the server side. If one subtracts the cs timestamp from this timestamp one will receive the whole time needed by the client to receive the response from the server.
Visualization of what Span and Trace will look in a system together with the Zipkin annotations:

Each color of a note signifies a span (7 spans - from A to G). If you have such information in the note:
Trace Id = X
Span Id = D
Client Sent
That means that the current span has Trace-Id set to X, Span-Id set to D. Also, the Client Sent event took place.
This is how the visualization of the parent / child relationship of spans would look like:

In the following sections the example from the image above will be taken into consideration.
Altogether there are 7 spans . If you go to traces in Zipkin you will see this number in the second trace:

However if you pick a particular trace then you will see 4 spans:

![[Note]](images/note.png) | Note |
|---|---|
When picking a particular trace you will see merged spans. That means that if there were 2 spans sent to Zipkin with Server Received and Server Sent / Client Received and Client Sent annotations then they will presented as a single span. |
Why is there a difference between the 7 and 4 spans in this case?
- 2 spans come from
http:/startspan. It has the Server Received (SR) and Server Sent (SS) annotations. - 2 spans come from the RPC call from
service1toservice2to thehttp:/fooendpoint. The Client Sent (CS) and Client Received (CR) events took place onservice1side. Server Received (SR) and Server Sent (SS) events took place on theservice2side. Physically there are 2 spans but they form 1 logical span related to an RPC call. - 2 spans come from the RPC call from
service2toservice3to thehttp:/barendpoint. The Client Sent (CS) and Client Received (CR) events took place onservice2side. Server Received (SR) and Server Sent (SS) events took place on theservice3side. Physically there are 2 spans but they form 1 logical span related to an RPC call. - 2 spans come from the RPC call from
service2toservice4to thehttp:/bazendpoint. The Client Sent (CS) and Client Received (CR) events took place onservice2side. Server Received (SR) and Server Sent (SS) events took place on theservice4side. Physically there are 2 spans but they form 1 logical span related to an RPC call.
So if we count the physical spans we have 1 from http:/start, 2 from service1 calling service2, 2 form service2
calling service3 and 2 from service2 calling service4. Altogether 7 spans.
Logically we see the information of Total Spans: 4 because we have 1 span related to the incoming request
to service1 and 3 spans related to RPC calls.
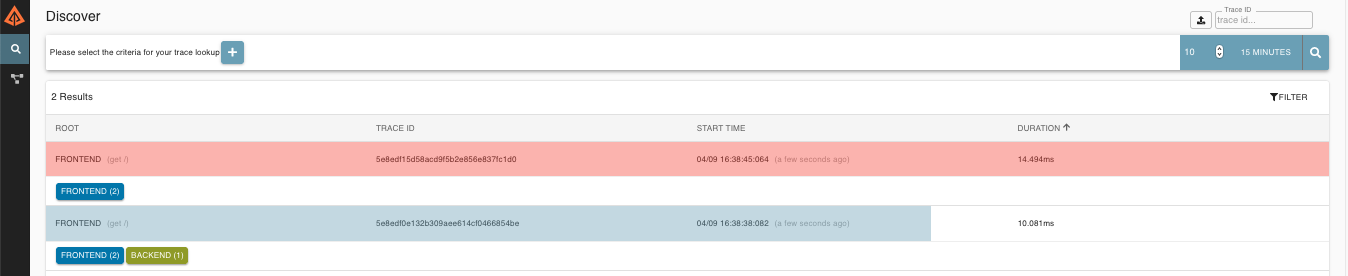
Zipkin allows you to visualize errors in your trace. When an exception was thrown and wasn’t caught then we’re setting proper tags on the span which Zipkin can properly colorize. You could see in the list of traces one trace that was in red color. That’s because there was an exception thrown.
If you click that trace then you’ll see a similar picture
Then if you click on one of the spans you’ll see the following
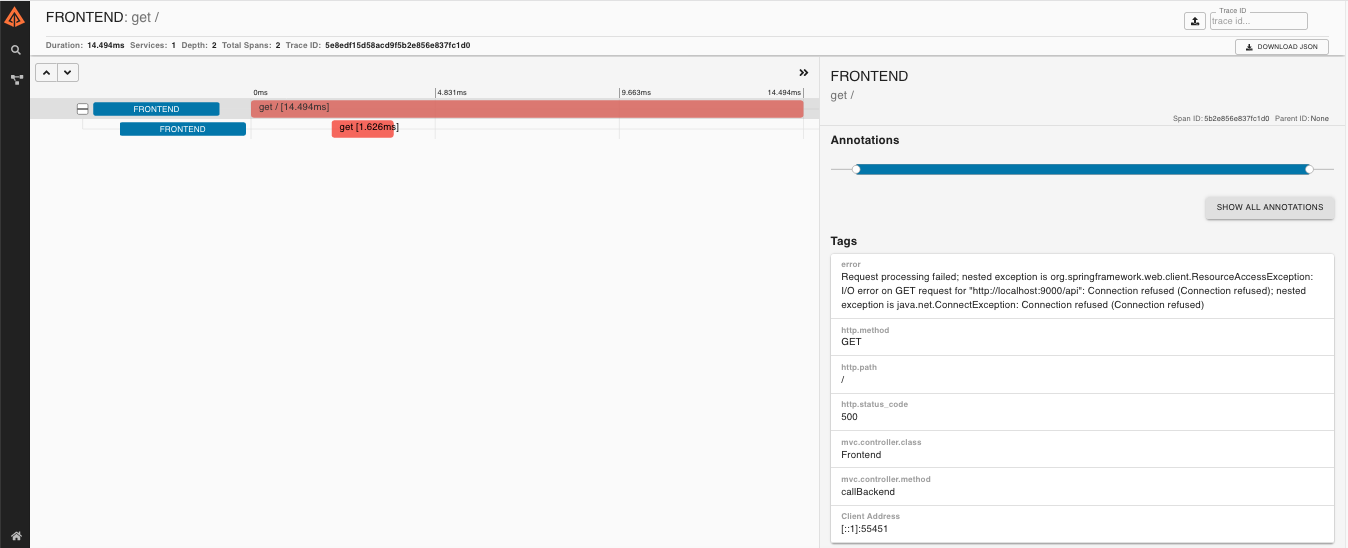
As you can see you can easily see the reason for an error and the whole stacktrace related to it.
Starting with version 2.0.0, Spring Cloud Sleuth uses
Brave as the tracing library. That means
that Sleuth no longer takes care of storing the context but it delegates
that work to Brave.
Due to the fact that Sleuth had different naming / tagging
conventions than Brave, we’ve decided to follow the Brave’s
conventions from now on. However, if you want to use the legacy
Sleuth approaches, it’s enough to set the spring.sleuth.http.legacy.enabled property
to true.

The dependency graph in Zipkin would look like this:

When grepping the logs of those four applications by trace id equal to e.g. 2485ec27856c56f4 one would get the following:
service1.log:2016-02-26 11:15:47.561  INFO [service1,2485ec27856c56f4,2485ec27856c56f4,true] 68058 --- [nio-8081-exec-1] i.s.c.sleuth.docs.service1.Application   : Hello from service1. Calling service2
service2.log:2016-02-26 11:15:47.710  INFO [service2,2485ec27856c56f4,9aa10ee6fbde75fa,true] 68059 --- [nio-8082-exec-1] i.s.c.sleuth.docs.service2.Application   : Hello from service2. Calling service3 and then service4
service3.log:2016-02-26 11:15:47.895  INFO [service3,2485ec27856c56f4,1210be13194bfe5,true] 68060 --- [nio-8083-exec-1] i.s.c.sleuth.docs.service3.Application   : Hello from service3
service2.log:2016-02-26 11:15:47.924  INFO [service2,2485ec27856c56f4,9aa10ee6fbde75fa,true] 68059 --- [nio-8082-exec-1] i.s.c.sleuth.docs.service2.Application   : Got response from service3 [Hello from service3]
service4.log:2016-02-26 11:15:48.134  INFO [service4,2485ec27856c56f4,1b1845262ffba49d,true] 68061 --- [nio-8084-exec-1] i.s.c.sleuth.docs.service4.Application   : Hello from service4
service2.log:2016-02-26 11:15:48.156  INFO [service2,2485ec27856c56f4,9aa10ee6fbde75fa,true] 68059 --- [nio-8082-exec-1] i.s.c.sleuth.docs.service2.Application   : Got response from service4 [Hello from service4]
service1.log:2016-02-26 11:15:48.182  INFO [service1,2485ec27856c56f4,2485ec27856c56f4,true] 68058 --- [nio-8081-exec-1] i.s.c.sleuth.docs.service1.Application   : Got response from service2 [Hello from service2, response from service3 [Hello from service3] and from service4 [Hello from service4]]
If you’re using a log aggregating tool like Kibana, Splunk etc. you can order the events that took place. An example of Kibana would look like this:
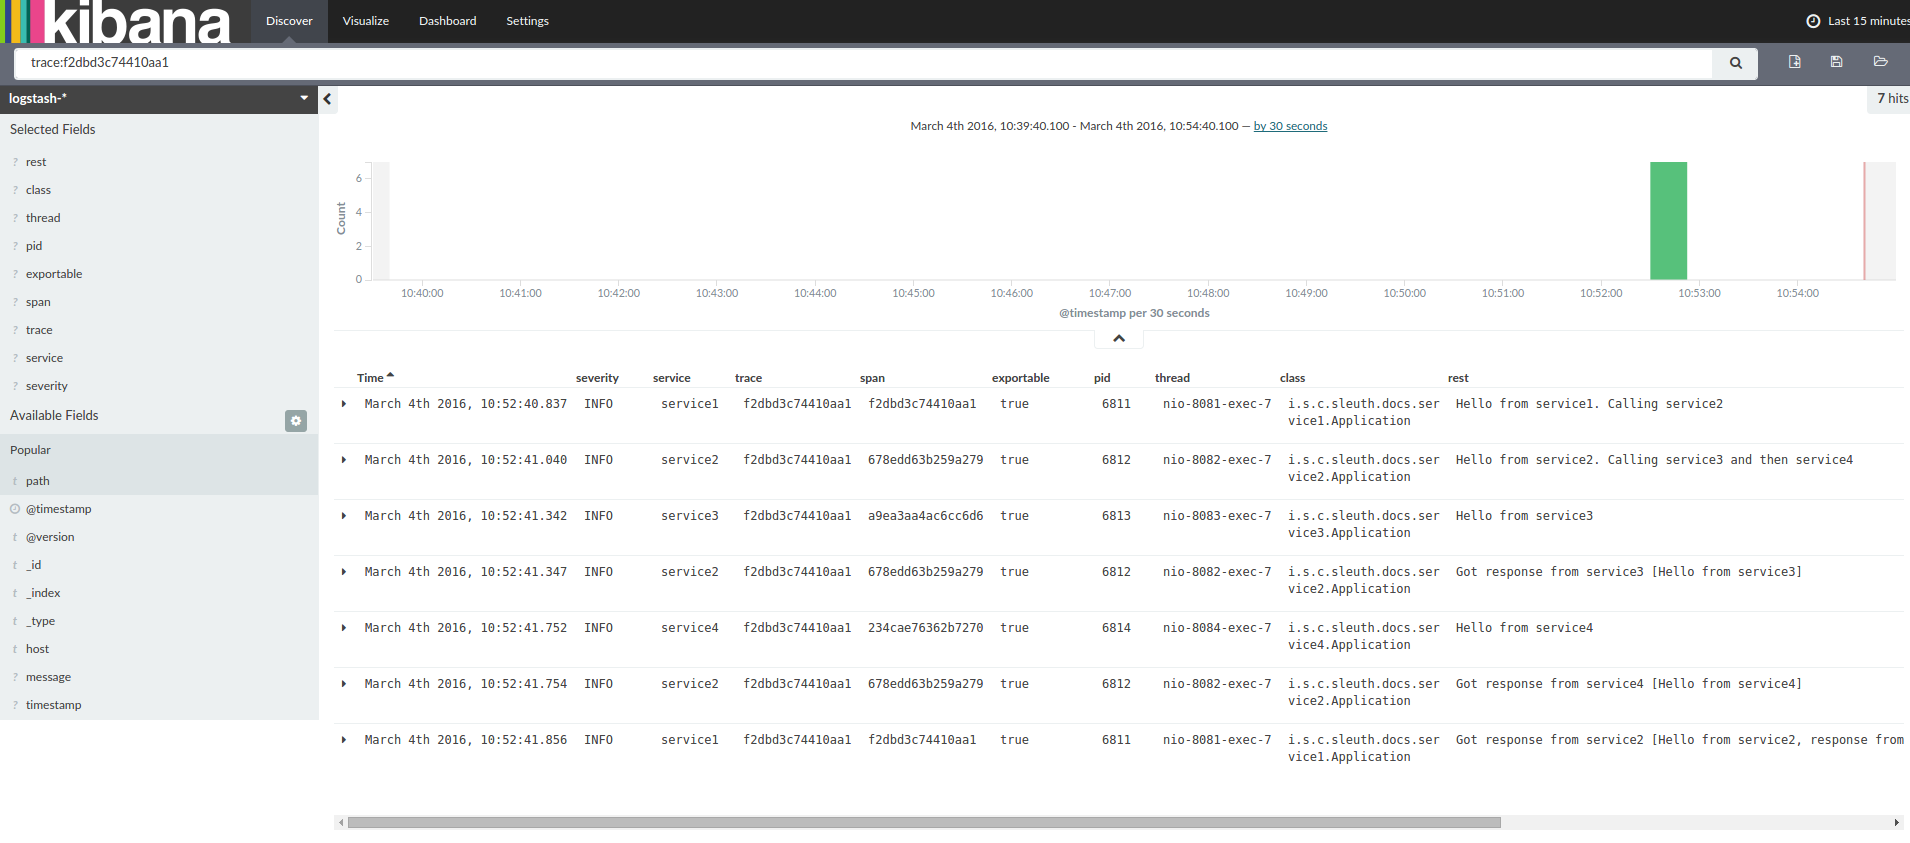
If you want to use Logstash here is the Grok pattern for Logstash:
filter {
       # pattern matching logback pattern
       grok {
              match => { "message" => "%{TIMESTAMP_ISO8601:timestamp}\s+%{LOGLEVEL:severity}\s+\[%{DATA:service},%{DATA:trace},%{DATA:span},%{DATA:exportable}\]\s+%{DATA:pid}\s+---\s+\[%{DATA:thread}\]\s+%{DATA:class}\s+:\s+%{GREEDYDATA:rest}" }
       }
} | Note |
|---|---|
If you want to use Grok together with the logs from Cloud Foundry you have to use this pattern: |
filter {
       # pattern matching logback pattern
       grok {
              match => { "message" => "(?m)OUT\s+%{TIMESTAMP_ISO8601:timestamp}\s+%{LOGLEVEL:severity}\s+\[%{DATA:service},%{DATA:trace},%{DATA:span},%{DATA:exportable}\]\s+%{DATA:pid}\s+---\s+\[%{DATA:thread}\]\s+%{DATA:class}\s+:\s+%{GREEDYDATA:rest}" }
       }
}Often you do not want to store your logs in a text file but in a JSON file that Logstash can immediately pick. To do that you have to do the following (for readability
we’re passing the dependencies in the groupId:artifactId:version notation.
Dependencies setup
- Ensure that Logback is on the classpath (
ch.qos.logback:logback-core) - Add Logstash Logback encode - example for version
4.6:net.logstash.logback:logstash-logback-encoder:4.6
Logback setup
Below you can find an example of a Logback configuration (file named logback-spring.xml) that:
- logs information from the application in a JSON format to a
build/${spring.application.name}.jsonfile - has commented out two additional appenders - console and standard log file
- has the same logging pattern as the one presented in the previous section
<?xml version="1.0" encoding="UTF-8"?> <configuration> <include resource="org/springframework/boot/logging/logback/defaults.xml"/> <springProperty scope="context" name="springAppName" source="spring.application.name"/> <!-- Example for logging into the build folder of your project --> <property name="LOG_FILE" value="${BUILD_FOLDER:-build}/${springAppName}"/> <!-- You can override this to have a custom pattern --> <property name="CONSOLE_LOG_PATTERN" value="%clr(%d{yyyy-MM-dd HH:mm:ss.SSS}){faint} %clr(${LOG_LEVEL_PATTERN:-%5p}) %clr(${PID:- }){magenta} %clr(---){faint} %clr([%15.15t]){faint} %clr(%-40.40logger{39}){cyan} %clr(:){faint} %m%n${LOG_EXCEPTION_CONVERSION_WORD:-%wEx}"/> <!-- Appender to log to console --> <appender name="console" class="ch.qos.logback.core.ConsoleAppender"> <filter class="ch.qos.logback.classic.filter.ThresholdFilter"> <!-- Minimum logging level to be presented in the console logs--> <level>DEBUG</level> </filter> <encoder> <pattern>${CONSOLE_LOG_PATTERN}</pattern> <charset>utf8</charset> </encoder> </appender> <!-- Appender to log to file --> <appender name="flatfile" class="ch.qos.logback.core.rolling.RollingFileAppender"> <file>${LOG_FILE}</file> <rollingPolicy class="ch.qos.logback.core.rolling.TimeBasedRollingPolicy"> <fileNamePattern>${LOG_FILE}.%d{yyyy-MM-dd}.gz</fileNamePattern> <maxHistory>7</maxHistory> </rollingPolicy> <encoder> <pattern>${CONSOLE_LOG_PATTERN}</pattern> <charset>utf8</charset> </encoder> </appender> <!-- Appender to log to file in a JSON format --> <appender name="logstash" class="ch.qos.logback.core.rolling.RollingFileAppender"> <file>${LOG_FILE}.json</file> <rollingPolicy class="ch.qos.logback.core.rolling.TimeBasedRollingPolicy"> <fileNamePattern>${LOG_FILE}.json.%d{yyyy-MM-dd}.gz</fileNamePattern> <maxHistory>7</maxHistory> </rollingPolicy> <encoder class="net.logstash.logback.encoder.LoggingEventCompositeJsonEncoder"> <providers> <timestamp> <timeZone>UTC</timeZone> </timestamp> <pattern> <pattern> { "severity": "%level", "service": "${springAppName:-}", "trace": "%X{X-B3-TraceId:-}", "span": "%X{X-B3-SpanId:-}", "parent": "%X{X-B3-ParentSpanId:-}", "exportable": "%X{X-Span-Export:-}", "pid": "${PID:-}", "thread": "%thread", "class": "%logger{40}", "rest": "%message" } </pattern> </pattern> </providers> </encoder> </appender> <root level="INFO"> <appender-ref ref="console"/> <!-- uncomment this to have also JSON logs --> <!--<appender-ref ref="logstash"/>--> <!--<appender-ref ref="flatfile"/>--> </root> </configuration>
| Note |
|---|---|
If you’re using a custom |
The span context is the state that must get propagated to any child Spans across process boundaries. Part of the Span Context is the Baggage. The trace and span IDs are a required part of the span context. Baggage is an optional part.
Baggage is a set of key:value pairs stored in the span context. Baggage travels together with the trace
and is attached to every span. Spring Cloud Sleuth will understand that a header is baggage related if the HTTP
header is prefixed with baggage- and for messaging it starts with baggage_.
![[Important]](images/important.png) | Important |
|---|---|
There’s currently no limitation of the count or size of baggage items. However, keep in mind that too many can decrease system throughput or increase RPC latency. In extreme cases, it could crash the app due to exceeding transport-level message or header capacity. |
Example of setting baggage on a span:
Unresolved directive in intro.adoc - include::https://raw.githubusercontent.com/spring-cloud/spring-cloud-sleuth/master/spring-cloud-sleuth-core/src/test/java/org/springframework/cloud/brave/instrument/web/multiple/MultipleHopsIntegrationTests.java[tags=baggage,indent=0]
}
Baggage travels with the trace (i.e. every child span contains the baggage of its parent). Zipkin has no knowledge of baggage and will not even receive that information.
Tags are attached to a specific span - they are presented for that particular span only. However you can search by tag to find the trace, where there exists a span having the searched tag value.
If you want to be able to lookup a span based on baggage, you should add corresponding entry as a tag in the root span.
| Important |
|---|---|
Remember that the span needs to be in scope! |
Unresolved directive in intro.adoc - include::https://raw.githubusercontent.com/spring-cloud/spring-cloud-sleuth/master/spring-cloud-sleuth-core/src/test/java/org/springframework/cloud/brave/instrument/web/multiple/MultipleHopsIntegrationTests.java[tags=baggage_tag,indent=0] | Important |
|---|---|
To ensure that your application name is properly displayed in Zipkin
set the |
If you want to profit only from Spring Cloud Sleuth without the Zipkin integration just add
the spring-cloud-starter-sleuth module to your project.
Maven.
<dependencyManagement><dependencies> <dependency> <groupId>org.springframework.cloud</groupId> <artifactId>spring-cloud-dependencies</artifactId> <version>${release.train.version}</version> <type>pom</type> <scope>import</scope> </dependency> </dependencies> </dependencyManagement> <dependency>
<groupId>org.springframework.cloud</groupId> <artifactId>spring-cloud-starter-sleuth</artifactId> </dependency>
| In order not to pick versions by yourself it’s much better if you add the dependency management via the Spring BOM |
| Add the dependency to |
Gradle.
dependencyManagement {
    imports {
        mavenBom "org.springframework.cloud:spring-cloud-dependencies:${releaseTrainVersion}"
    }
}

dependencies {
    compile "org.springframework.cloud:spring-cloud-starter-sleuth"
}
| In order not to pick versions by yourself it’s much better if you add the dependency management via the Spring BOM |
| Add the dependency to |
If you want both Sleuth and Zipkin just add the spring-cloud-starter-zipkin dependency.
Maven.
<dependencyManagement>
| In order not to pick versions by yourself it’s much better if you add the dependency management via the Spring BOM |
| Add the dependency to |
Gradle.
dependencyManagement {
    imports {
        mavenBom "org.springframework.cloud:spring-cloud-dependencies:${releaseTrainVersion}"
    }
}

dependencies {
    compile "org.springframework.cloud:spring-cloud-starter-zipkin"
}
| In order not to pick versions by yourself it’s much better if you add the dependency management via the Spring BOM |
| Add the dependency to |
If you want to use RabbitMQ or Kafka instead of http, add the spring-rabbit or spring-kafka
dependencies. The default destination name is zipkin.
Note: spring-cloud-sleuth-stream is deprecated and incompatible with these destinations
If you want Sleuth over RabbitMQ add the spring-cloud-starter-zipkin and spring-rabbit
dependencies.
Maven.
<dependencyManagement><groupId>org.springframework.amqp</groupId> <artifactId>spring-rabbit</artifactId> </dependency>
| In order not to pick versions by yourself it’s much better if you add the dependency management via the Spring BOM |
| Add the dependency to |
| To automatically configure rabbit, simply add the spring-rabbit dependency |
Gradle.
dependencyManagement {
    imports {
        mavenBom "org.springframework.cloud:spring-cloud-dependencies:${releaseTrainVersion}"
    }
}

dependencies {
    compile "org.springframework.cloud:spring-cloud-starter-zipkin"
    compile "org.springframework.amqp:spring-rabbit"
}
| In order not to pick versions by yourself it’s much better if you add the dependency management via the Spring BOM |
| Add the dependency to |
| To automatically configure rabbit, simply add the spring-rabbit dependency |
Marcin Grzejszczak talking about Spring Cloud Sleuth and Zipkin
Adds trace and span ids to the Slf4J MDC, so you can extract all the logs from a given trace or span in a log aggregator. Example logs:
2016-02-02 15:30:57.902  INFO [bar,6bfd228dc00d216b,6bfd228dc00d216b,false] 23030 --- [nio-8081-exec-3] ...
2016-02-02 15:30:58.372 ERROR [bar,6bfd228dc00d216b,6bfd228dc00d216b,false] 23030 --- [nio-8081-exec-3] ...
2016-02-02 15:31:01.936  INFO [bar,46ab0d418373cbc9,46ab0d418373cbc9,false] 23030 --- [nio-8081-exec-4] ...
notice the
[appname,traceId,spanId,exportable]entries from the MDC:- spanId - the id of a specific operation that took place
- appname - the name of the application that logged the span
- traceId - the id of the latency graph that contains the span
- exportable - whether the log should be exported to Zipkin or not. When would you like the span not to be exportable? In the case in which you want to wrap some operation in a Span and have it written to the logs only.
- Provides an abstraction over common distributed tracing data models: traces, spans (forming a DAG), annotations, key-value annotations. Loosely based on HTrace, but Zipkin (Dapper) compatible.
Sleuth records timing information to aid in latency analysis. Using sleuth, you can pinpoint causes of latency in your applications. Sleuth is written to not log too much, and to not cause your production application to crash.
- propagates structural data about your call-graph in-band, and the rest out-of-band.
- includes opinionated instrumentation of layers such as HTTP
- includes sampling policy to manage volume
- can report to a Zipkin system for query and visualization
- Instruments common ingress and egress points from Spring applications (servlet filter, async endpoints, rest template, scheduled actions, message channels, zuul filters, feign client).
- Sleuth includes default logic to join a trace across http or messaging boundaries. For example, http propagation
works via Zipkin-compatible request headers. This propagation logic is defined and customized via
SpanInjectorandSpanExtractorimplementations. - Sleuth gives you the possibility to propagate context (also known as baggage) between processes. That means that if you set on a Span a baggage element then it will be sent downstream either via HTTP or messaging to other processes.
- Provides a way to create / continue spans and add tags and logs via annotations.
- Provides simple metrics of accepted / dropped spans.
If
spring-cloud-sleuth-zipkinthen the app will generate and collect Zipkin-compatible traces. By default it sends them via HTTP to a Zipkin server on localhost (port 9411). Configure the location of the service usingspring.zipkin.baseUrl.- If you depend on
spring-rabbitorspring-kafkayour app will send traces to a broker instead of http. - Note:
spring-cloud-sleuth-streamis deprecated and should no longer be used.
- If you depend on
| Important |
|---|---|
If using Zipkin, configure the percentage of spans exported using |
| Note |
|---|---|
the SLF4J MDC is always set and logback users will immediately see the trace and span ids in logs per the example
above. Other logging systems have to configure their own formatter to get the same result. The default is
|
| Important |
|---|---|
Starting with version |
Brave is a library used to capture and report latency information about distributed operations to Zipkin. Most users won’t use Brave directly, rather libraries or frameworks than employ Brave on their behalf.
This module includes tracer creates and joins spans that model the latency of potentially distributed work. It also includes libraries to propagate the trace context over network boundaries, for example, via http headers.
Most importantly, you need a brave.Tracer, configured to [report to Zipkin]
(https://github.com/openzipkin/zipkin-reporter-java).
Here’s an example setup that sends trace data (spans) to Zipkin over http (as opposed to Kafka).
class MyClass {

    private final Tracer tracer;

    // Tracer will be autowired
    MyClass(Tracer tracer) {
        this.tracer = tracer;
    }

    void doSth() {
        Span span = tracer.newTrace().name("encode").start();
        // ...
    }
}
| Important |
|---|---|
If your span contains a name greater than 50 chars, then that name will be truncated to 50 chars. Your names have to be explicit and concrete. Big names lead to latency issues and sometimes even thrown exceptions. |
The tracer creates and joins spans that model the latency of potentially distributed work. It can employ sampling to reduce overhead in process or to reduce the amount of data sent to Zipkin.
Spans returned by a tracer report data to Zipkin when finished, or do nothing if unsampled. After starting a span, you can annotate events of interest or add tags containing details or lookup keys.
Spans have a context which includes trace identifiers that place it at the correct spot in the tree representing the distributed operation.
When tracing local code, just run it inside a span.
Span span = tracer.newTrace().name("encode").start();
try {
  doSomethingExpensive();
} finally {
  span.finish();
}
In the above example, the span is the root of the trace. In many cases,
you will be a part of an existing trace. When this is the case, call
newChild instead of newTrace
Span span = tracer.newChild(root.context()).name("encode").start();
try {
  doSomethingExpensive();
} finally {
  span.finish();
}
Once you have a span, you can add tags to it, which can be used as lookup keys or details. For example, you might add a tag with your runtime version.
span.tag("clnt/finagle.version", "6.36.0");
When exposing the ability to customize spans to third parties, prefer
brave.SpanCustomizer as opposed to brave.Span. The former is simpler to
understand and test, and doesn’t tempt users with span lifecycle hooks.
interface MyTraceCallback {
  void request(Request request, SpanCustomizer customizer);
}
Since brave.Span implements brave.SpanCustomizer, it is just as easy for you
to pass to users.
Ex.
for (MyTraceCallback callback : userCallbacks) {
  callback.request(request, span);
}Sometimes you won’t know if a trace is in progress or not, and you don’t
want users to do null checks. brave.CurrentSpanCustomizer adds to any
span that’s in progress or drops data accordingly.
Ex.
// user code can then inject this without a chance of it being null.
@Autowire SpanCustomizer span;

void userCode() {
  span.annotate("tx.started");
  ...
}
Check for instrumentation written here and Zipkin’s list before rolling your own RPC instrumentation!
RPC tracing is often done automatically by interceptors. Under the scenes, they add tags and events that relate to their role in an RPC operation.
Here’s an example of a client span:
// before you send a request, add metadata that describes the operation
span = tracer.newTrace().name("get").type(CLIENT);
span.tag("clnt/finagle.version", "6.36.0");
span.tag(TraceKeys.HTTP_PATH, "/api");
span.remoteEndpoint(Endpoint.builder()
    .serviceName("backend")
    .ipv4(127 << 24 | 1)
    .port(8080).build());

// when the request is scheduled, start the span
span.start();

// if you have callbacks for when data is on the wire, note those events
span.annotate(Constants.WIRE_SEND);
span.annotate(Constants.WIRE_RECV);

// when the response is complete, finish the span
span.finish();
Sometimes you need to model an asynchronous operation, where there is a
request, but no response. In normal RPC tracing, you use span.finish()
which indicates the response was received. In one-way tracing, you use
span.flush() instead, as you don’t expect a response.
Here’s how a client might model a one-way operation
// start a new span representing a client request
oneWaySend = tracer.newSpan(parent).kind(Span.Kind.CLIENT);

// Add the trace context to the request, so it can be propagated in-band
tracing.propagation().injector(Request::addHeader)
                     .inject(oneWaySend.context(), request);

// fire off the request asynchronously, totally dropping any response
request.execute();

// start the client side and flush instead of finish
oneWaySend.start().flush();
And here’s how a server might handle this..
// pull the context out of the incoming request
extractor = tracing.propagation().extractor(Request::getHeader);

// convert that context to a span which you can name and add tags to
oneWayReceive = nextSpan(tracer, extractor.extract(request))
    .name("process-request")
    .kind(SERVER)
    ... add tags etc.

// start the server side and flush instead of finish
oneWayReceive.start().flush();

// you should not modify this span anymore as it is complete. However,
// you can create children to represent follow-up work.
next = tracer.newSpan(oneWayReceive.context()).name("step2").start();
Note The above propagation logic is a simplified version of our [http handlers](https://github.com/openzipkin/sleuth/tree/master/instrumentation/http#http-server).
There’s a working example of a one-way span [here](src/test/java/sleuth/features/async/OneWaySpanTest.java).
Sampling may be employed to reduce the data collected and reported out of process. When a span isn’t sampled, it adds no overhead (noop).
Sampling is an up-front decision, meaning that the decision to report data is made at the first operation in a trace, and that decision is propagated downstream.
By default, there’s a global sampler that applies a single rate to all
traced operations. Tracer.Builder.sampler is how you indicate this,
and it defaults to trace every request.
Some need to sample based on the type or annotations of a java method.
Most users will use a framework interceptor which automates this sort of policy. Here’s how they might work internally.
// derives a sample rate from an annotation on a java method
DeclarativeSampler<Traced> sampler = DeclarativeSampler.create(Traced::sampleRate);

@Around("@annotation(traced)")
public Object traceThing(ProceedingJoinPoint pjp, Traced traced) throws Throwable {
  Span span = tracing.tracer().newTrace(sampler.sample(traced))...
  try {
    return pjp.proceed();
  } finally {
    span.finish();
  }
}
You may want to apply different policies depending on what the operation is. For example, you might not want to trace requests to static resources such as images, or you might want to trace all requests to a new api.
Most users will use a framework interceptor which automates this sort of policy. Here’s how they might work internally.
Span newTrace(Request input) {
  SamplingFlags flags = SamplingFlags.NONE;
  if (input.url().startsWith("/experimental")) {
    flags = SamplingFlags.SAMPLED;
  } else if (input.url().startsWith("/static")) {
    flags = SamplingFlags.NOT_SAMPLED;
  }
  return tracer.newTrace(flags);
}
Note: the above is the basis for the built-in http sampler
Spring Cloud Sleuth by default sets all spans to non-exportable.
That means that you will see traces in logs, but not in any remote store.
For testing the default is often enough, and it probably is all you need
if you are only using the logs (e.g. with an ELK aggregator). If you are
exporting span data to Zipkin, there is also an Sampler.ALWAYS_SAMPLE
that exports everything and a ProbabilityBasedSampler that samples a
fixed fraction of spans.
| Note |
|---|---|
The |
A sampler can be installed just by creating a bean definition, e.g:
@Bean
public Sampler defaultSampler() {
	return Sampler.ALWAYS_SAMPLE;
}
| Tip |
|---|---|
You can set the HTTP header |
Propagation is needed to ensure activity originating from the same root are collected together in the same trace. The most common propagation approach is to copy a trace context from a client sending an RPC request to a server receiving it.
For example, when an downstream Http call is made, its trace context is sent along with it, encoded as request headers:
   Client Span                                                Server Span
┌──────────────────┐                                       ┌──────────────────┐
│                  │                                       │                  │
│   TraceContext   │           Http Request Headers        │   TraceContext   │
│ ┌──────────────┐ │          ┌───────────────────┐        │ ┌──────────────┐ │
│ │ TraceId      │ │          │ X─B3─TraceId      │        │ │ TraceId      │ │
│ │              │ │          │                   │        │ │              │ │
│ │ ParentSpanId │ │ Extract  │ X─B3─ParentSpanId │ Inject │ │ ParentSpanId │ │
│ │              ├─┼─────────>│                   ├────────┼>│              │ │
│ │ SpanId       │ │          │ X─B3─SpanId       │        │ │ SpanId       │ │
│ │              │ │          │                   │        │ │              │ │
│ │ Sampled      │ │          │ X─B3─Sampled      │        │ │ Sampled      │ │
│ └──────────────┘ │          └───────────────────┘        │ └──────────────┘ │
│                  │                                       │                  │
└──────────────────┘                                       └──────────────────┘
The names above are from B3 Propagation, which is built-in to Brave and has implementations in many languages and frameworks.
Most users will use a framework interceptor which automates propagation. Here’s how they might work internally.
Here’s what client-side propagation might look like
// configure a function that injects a trace context into a request
injector = tracing.propagation().injector(Request.Builder::addHeader);

// before a request is sent, add the current span's context to it
injector.inject(span.context(), request);
Here’s what server-side propagation might look like
// configure a function that extracts the trace context from a request
extracted = tracing.propagation().extractor(Request::getHeader);

// when a server receives a request, it joins or starts a new trace
span = tracer.nextSpan(extracted, request);
Sometimes you need to propagate extra fields, such as a request ID or an alternate trace context. For example, if you are in a Cloud Foundry environment, you might want to pass the request ID:
// when you initialize the builder, define the extra field you want to propagate
tracingBuilder.propagationFactory(
  ExtraFieldPropagation.newFactory(B3Propagation.FACTORY, "x-vcap-request-id")
);

// later, you can tag that request ID or use it in log correlation
requestId = ExtraFieldPropagation.get("x-vcap-request-id");
You may also need to propagate a trace context you aren’t using. For example, you may be in an Amazon Web Services environment, but not reporting data to X-Ray. To ensure X-Ray can co-exist correctly, pass-through its tracing header like so.
tracingBuilder.propagationFactory(
  ExtraFieldPropagation.newFactory(B3Propagation.FACTORY, "x-amzn-trace-id")
);You can also prefix fields, if they follow a common pattern. For example, the following will propagate the field "x-vcap-request-id" as-is, but send the fields "country-code" and "user-id" on the wire as "x-baggage-country-code" and "x-baggage-user-id" respectively.
Setup your tracing instance with allowed fields:
tracingBuilder.propagationFactory(
  ExtraFieldPropagation.newFactoryBuilder(B3Propagation.FACTORY)
                       .addField("x-vcap-request-id")
                       .addPrefixedFields("baggage-", Arrays.asList("country-code", "user-id"))
                       .build()
);
Later, you can call below to affect the country code of the current trace context
ExtraFieldPropagation.set("country-code", "FO");
String countryCode = ExtraFieldPropagation.get("country-code");
Or, if you have a reference to a trace context, use it explicitly
ExtraFieldPropagation.set(span.context(), "country-code", "FO");
String countryCode = ExtraFieldPropagation.get(span.context(), "country-code");
| Important |
|---|---|
In comparison to previous versions of Sleuth, with
Brave it’s required to pass the list of baggage keys.
There are two properties to achieve this. Via the |
The TraceContext.Extractor<C> reads trace identifiers and sampling status
from an incoming request or message. The carrier is usually a request object
or headers.
This utility is used in standard instrumentation like [HttpServerHandler](../instrumentation/http/src/main/java/sleuth/http/HttpServerHandler.java), but can also be used for custom RPC or messaging code.
TraceContextOrSamplingFlags is usually only used with Tracer.nextSpan(extracted), unless you are
sharing span IDs between a client and a server.
A normal instrumentation pattern is creating a span representing the server
side of an RPC. Extractor.extract might return a complete trace context when
applied to an incoming client request. Tracer.joinSpan attempts to continue
the this trace, using the same span ID if supported, or creating a child span
if not. When span ID is shared, data reported includes a flag saying so.
Here’s an example of B3 propagation:
                              ┌───────────────────┐      ┌───────────────────┐
 Incoming Headers             │   TraceContext    │      │   TraceContext    │
┌───────────────────┐(extract)│ ┌───────────────┐ │(join)│ ┌───────────────┐ │
│ X─B3-TraceId      │─────────┼─┼> TraceId      │ │──────┼─┼> TraceId      │ │
│                   │         │ │               │ │      │ │               │ │
│ X─B3-ParentSpanId │─────────┼─┼> ParentSpanId │ │──────┼─┼> ParentSpanId │ │
│                   │         │ │               │ │      │ │               │ │
│ X─B3-SpanId       │─────────┼─┼> SpanId       │ │──────┼─┼> SpanId       │ │
└───────────────────┘         │ │               │ │      │ │               │ │
                              │ │               │ │      │ │  Shared: true │ │
                              │ └───────────────┘ │      │ └───────────────┘ │
                              └───────────────────┘      └───────────────────┘
Some propagation systems only forward the parent span ID, detected when
Propagation.Factory.supportsJoin() == false. In this case, a new span ID is
always provisioned and the incoming context determines the parent ID.
Here’s an example of AWS propagation:
                              ┌───────────────────┐      ┌───────────────────┐
 x-amzn-trace-id              │   TraceContext    │      │   TraceContext    │
┌───────────────────┐(extract)│ ┌───────────────┐ │(join)│ ┌───────────────┐ │
│ Root              │─────────┼─┼> TraceId      │ │──────┼─┼> TraceId      │ │
│                   │         │ │               │ │      │ │               │ │
│ Parent            │─────────┼─┼> SpanId       │ │──────┼─┼> ParentSpanId │ │
└───────────────────┘         │ └───────────────┘ │      │ │               │ │
                              └───────────────────┘      │ │  SpanId: New  │ │
                                                         │ └───────────────┘ │
                                                         └───────────────────┘
Note: Some span reporters do not support sharing span IDs. For example, if you
set Tracing.Builder.spanReporter(amazonXrayOrGoogleStackdrive), disable join
via Tracing.Builder.supportsJoin(false). This will force a new child span on
Tracer.joinSpan().
TraceContext.Extractor<C> is implemented by a Propagation.Factory plugin. Internally, this code
will create the union type TraceContextOrSamplingFlags with one of the following:
* TraceContext if trace and span IDs were present.
* TraceIdContext if a trace ID was present, but not span IDs.
* SamplingFlags if no identifiers were present
Some Propagation implementations carry extra data from point of extraction (ex reading incoming
headers) to injection (ex writing outgoing headers). For example, it might carry a request ID. When
implementations have extra data, here’s how they handle it.
* If a TraceContext was extracted, add the extra data as TraceContext.extra()
* Otherwise, add it as TraceContextOrSamplingFlags.extra(), which Tracer.nextSpan handles.
Brave supports a "current tracing component" concept which should only be used when you have no other means to get a reference. This was made for JDBC connections, as they often initialize prior to the tracing component.
The most recent tracing component instantiated is available via
Tracing.current(). You there’s also a shortcut to get only the tracer
via Tracing.currentTracer(). If you use either of these methods, do
noot cache the result. Instead, look them up each time you need them.
Brave supports a "current span" concept which represents the in-flight
operation. Tracer.currentSpan() can be used to add custom tags to a
span and Tracer.nextSpan() can be used to create a child of whatever
is in-flight.
When writing new instrumentation, it is important to place a span you
created in scope as the current span. Not only does this allow users to
access it with Tracer.currentSpan(), but it also allows customizations
like SLF4J MDC to see the current trace IDs.
Tracer.withSpanInScope(Span) facilitates this and is most conveniently
employed via the try-with-resources idiom. Whenever external code might
be invoked (such as proceeding an interceptor or otherwise), place the
span in scope like this.
try (SpanInScope ws = tracer.withSpanInScope(span)) {
  return inboundRequest.invoke();
} finally { // note the scope is independent of the span
  span.finish();
}
In edge cases, you may need to clear the current span temporarily. For
example, launching a task that should not be associated with the current
request. To do this, simply pass null to withSpanInScope.
try (SpanInScope cleared = tracer.withSpanInScope(null)) {
  startBackgroundThread();
}Spring Cloud Sleuth instruments all your Spring application
automatically, so you shouldn’t have to do anything to activate
it. The instrumentation is added using a variety of technologies
according to the stack that is available, e.g. for a servlet web
application we use a Filter, and for Spring Integration we use
ChannelInterceptors.
You can customize the keys used in span tags. To limit the volume of
span data, by default an HTTP request will be tagged only with a
handful of metadata like the status code, host and URL. You can add
request headers by configuring spring.sleuth.keys.http.headers (a
list of header names).
| Note |
|---|---|
Remember that tags are only collected and exported if there is a
|
You can do the following operations on the Span by means of brave.Tracer:
- start - when you start a span its name is assigned and start timestamp is recorded.
- close - the span gets finished (the end time of the span is recorded) and if the span is sampled then it will be eligible for collection to e.g. Zipkin.
- continue - a new instance of span will be created whereas it will be a copy of the one that it continues.
- detach - the span doesn’t get stopped or closed. It only gets removed from the current thread.
- create with explicit parent - you can create a new span and set an explicit parent to it
| Tip |
|---|---|
Spring Cloud Sleuth creates the instance of |
You can manually create spans by using the Tracer.
// Start a span. If there was a span present in this thread it will become
// the `newSpan`'s parent.
Span newSpan = this.tracer.nextSpan().name("calculateTax");
try (Tracer.SpanInScope ws = this.tracer.withSpanInScope(newSpan.start())) {
	// ...
	// You can tag a span
	newSpan.tag("taxValue", taxValue);
	// ...
	// You can log an event on a span
	newSpan.annotate("taxCalculated");
} finally {
	// Once done remember to finish the span. This will allow collecting
	// the span to send it to Zipkin
	newSpan.finish();
}
In this example we could see how to create a new instance of span. Assuming that there already was a span present in this thread then it would become the parent of that span.
| Important |
|---|---|
Always clean after you create a span! Don’t forget to finish a span if you want to send it to Zipkin. |
| Important |
|---|---|
If your span contains a name greater than 50 chars, then that name will be truncated to 50 chars. Your names have to be explicit and concrete. Big names lead to latency issues and sometimes even thrown exceptions. |
Sometimes you don’t want to create a new span but you want to continue one. Example of such a situation might be (of course it all depends on the use-case):
- AOP - If there was already a span created before an aspect was reached then you might not want to create a new span.
- Hystrix - executing a Hystrix command is most likely a logical part of the current processing. It’s in fact only a technical implementation detail that you wouldn’t necessarily want to reflect in tracing as a separate being.
To continue a span you can use brave.Tracer.
// let's assume that we're in a thread Y and we've received
// the `initialSpan` from thread X
Span continuedSpan = this.tracer.joinSpan(newSpan.context());
try {
	// ...
	// You can tag a span
	continuedSpan.tag("taxValue", taxValue);
	// ...
	// You can log an event on a span
	continuedSpan.annotate("taxCalculated");
} finally {
	// Once done remember to flush the span. That means that
	// it will get reported but the span itself is not yet finished
	continuedSpan.flush();
}
There is a possibility that you want to start a new span and provide an explicit parent of that span.
Let’s assume that the parent of a span is in one thread and you want to start a new span in another thread.
In Brave, whenever you call nextSpan(), it’s creating one in reference
to the span being currently in scope. It’s enough to just put
the span in scope and then call nextSpan(), as presented in the example below:
// let's assume that we're in a thread Y and we've received
// the `initialSpan` from thread X. `initialSpan` will be the parent
// of the `newSpan`
Span newSpan = null;
try (Tracer.SpanInScope ws = this.tracer.withSpanInScope(initialSpan)) {
	newSpan = this.tracer.nextSpan().name("calculateCommission");
	// ...
	// You can tag a span
	newSpan.tag("commissionValue", commissionValue);
	// ...
	// You can log an event on a span
	newSpan.annotate("commissionCalculated");
} finally {
	// Once done remember to finish the span. This will allow collecting
	// the span to send it to Zipkin. The tags and events set on the
	// newSpan will not be present on the parent
	if (newSpan != null) {
		newSpan.finish();
	}
}
| Important |
|---|---|
After having created such a span remember to finish it, otherwise it will not get reported to e.g. Zipkin |
Picking a span name is not a trivial task. Span name should depict an operation name. The name should be low cardinality (e.g. not include identifiers).
Since there is a lot of instrumentation going on some of the span names will be artificial like:
controller-method-namewhen received by a Controller with a method nameconrollerMethodNameasyncfor asynchronous operations done via wrappedCallableandRunnable.@Scheduledannotated methods will return the simple name of the class.
Fortunately, for the asynchronous processing you can provide explicit naming.
You can name the span explicitly via the @SpanName annotation.
@SpanName("calculateTax")
class TaxCountingRunnable implements Runnable {

	@Override public void run() {
		// perform logic
	}
}
In this case, when processed in the following manner:
Runnable runnable = new TraceRunnable(tracer, spanNamer, errorParser,
		new TaxCountingRunnable());
Future<?> future = executorService.submit(runnable);
// ... some additional logic ...
future.get();
The span will be named calculateTax.
It’s pretty rare to create separate classes for Runnable or Callable. Typically one creates an anonymous
instance of those classes. You can’t annotate such classes thus to override that, if there is no @SpanName annotation present,
we’re checking if the class has a custom implementation of the toString() method.
So executing such code:
Runnable runnable = new TraceRunnable(tracer, spanNamer, errorParser, new Runnable() {
	@Override public void run() {
		// perform logic
	}

	@Override public String toString() {
		return "calculateTax";
	}
});
Future<?> future = executorService.submit(runnable);
// ... some additional logic ...
future.get();
will lead in creating a span named calculateTax.
The main arguments for this features are
api-agnostic means to collaborate with a span
- use of annotations allows users to add to a span with no library dependency on a span api. This allows Sleuth to change its core api less impact to user code.
reduced surface area for basic span operations.
- without this feature one has to use the span api, which has lifecycle commands that could be used incorrectly. By only exposing scope, tag and log functionality, users can collaborate without accidentally breaking span lifecycle.
collaboration with runtime generated code
- with libraries such as Spring Data / Feign the implementations of interfaces are generated at runtime thus span wrapping of objects was tedious. Now you can provide annotations over interfaces and arguments of those interfaces
If you really don’t want to take care of creating local spans manually you can profit from the
@NewSpan annotation. Also we give you the @SpanTag annotation to add tags in an automated
fashion.
Let’s look at some examples of usage.
@NewSpan
void testMethod();
Annotating the method without any parameter will lead to a creation of a new span whose name will be equal to annotated method name.
@NewSpan("customNameOnTestMethod4")
void testMethod4();
If you provide the value in the annotation (either directly or via the name parameter) then
the created span will have the name as the provided value.
// method declaration
@NewSpan(name = "customNameOnTestMethod5")
void testMethod5(@SpanTag("testTag") String param);

// and method execution
this.testBean.testMethod5("test");
You can combine both the name and a tag. Let’s focus on the latter. In this case whatever the value of
the annotated method’s parameter runtime value will be - that will be the value of the tag. In our sample
the tag key will be testTag and the tag value will be test.
@NewSpan(name = "customNameOnTestMethod3")
@Override
public void testMethod3() {
}
You can place the @NewSpan annotation on both the class and an interface. If you override the
interface’s method and provide a different value of the @NewSpan annotation then the most
concrete one wins (in this case customNameOnTestMethod3 will be set).
If you want to just add tags and annotations to an existing span it’s enough
to use the @ContinueSpan annotation as presented below. Note that in contrast
with the @NewSpan annotation you can also add logs via the log parameter:
// method declaration
@ContinueSpan(log = "testMethod11")
void testMethod11(@SpanTag("testTag11") String param);

// method execution
this.testBean.testMethod11("test");
this.testBean.testMethod13();
That way the span will get continued and:
- logs with name
testMethod11.beforeandtestMethod11.afterwill be created - if an exception will be thrown a log
testMethod11.afterFailurewill also be created - tag with key
testTag11and valuetestwill be created
There are 3 different ways to add tags to a span. All of them are controlled by the SpanTag annotation.
Precedence is:
- try with the bean of
TagValueResolvertype and provided name - if one hasn’t provided the bean name, try to evaluate an expression. We’re searching for a
TagValueExpressionResolverbean. The default implementation uses SPEL expression resolution. - if one hasn’t provided any expression to evaluate just return a
toString()value of the parameter
The value of the tag for following method will be computed by an implementation of TagValueResolver interface.
Its class name has to be passed as the value of the resolver attribute.
Having such an annotated method:
@NewSpan
public void getAnnotationForTagValueResolver(@SpanTag(key = "test", resolver = TagValueResolver.class) String test) {
}
and such a TagValueResolver bean implementation
@Bean(name = "myCustomTagValueResolver")
public TagValueResolver tagValueResolver() {
	return parameter -> "Value from myCustomTagValueResolver";
}
Will lead to setting of a tag value equal to Value from myCustomTagValueResolver.
Having such an annotated method:
@NewSpan
public void getAnnotationForTagValueExpression(@SpanTag(key = "test", expression = "length() + ' characters'") String test) {
}
and no custom implementation of a TagValueExpressionResolver will lead to evaluation of the SPEL expression and a tag with value 4 characters will be set on the span.
If you want to use some other expression resolution mechanism you can create your own implementation
of the bean.
You can also modify the behaviour of the TraceFilter - the component that is responsible
for processing the input HTTP request and adding tags basing on the HTTP response. You can customize
the tags, or modify the response headers by registering your own instance of the TraceFilter bean.
In the following example we will register the TraceFilter bean and we will add the
ZIPKIN-TRACE-ID response header containing the current Span’s trace id. Also we will
add to the Span a tag with key custom and a value tag.
@Component
@Order(TraceFilter.ORDER + 1)
class MyFilter extends GenericFilterBean {

	private final Tracer tracer;

	MyFilter(Tracer tracer) {
		this.tracer = tracer;
	}

	@Override public void doFilter(ServletRequest request, ServletResponse response,
			FilterChain chain) throws IOException, ServletException {
		Span currentSpan = this.tracer.currentSpan();
		then(currentSpan).isNotNull();
		// for readability we're returning trace id in a hex form
		((HttpServletResponse) response)
				.addHeader("ZIPKIN-TRACE-ID",
						currentSpan.context().traceIdString());
		// we can also add some custom tags
		currentSpan.tag("custom", "tag");
		chain.doFilter(request, response);
	}
}
By default Sleuth assumes that when you send a span to Zipkin, you want the span’s service name
to be equal to spring.application.name value. That’s not always the case though. There
are situations in which you want to explicitly provide a different service name for all spans coming
from your application. To achieve that it’s enough to just pass the following property
to your application to override that value (example for foo service name):
spring.zipkin.service.name: fooBefore reporting spans to e.g. Zipkin you can be interested in modifying that span in some way.
You can achieve that by using the SpanAdjuster interface.
In Sleuth we’re generating spans with a fixed name. Some users want to modify the name depending on values
of tags. Implementation of the SpanAdjuster interface can be used to alter that name. Example:
Example. If you register two beans of SpanAdjuster type:
Unresolved directive in spring-cloud-sleuth.adoc - include::../../../..//spring-cloud-sleuth-core/src/test/java/org/springframework/cloud/sleuth/autoconfig/SpanAdjusterAspectTests.java[tags=adjuster,indent=0]This will lead in changing the name of the reported span to foo bar, just before it gets reported (e.g. to Zipkin).
| Important |
|---|---|
This section is about defining host from service discovery. It’s NOT about finding Zipkin in service discovery. |
In order to define the host that is corresponding to a particular span we need to resolve the host name and port. The default approach is to take it from server properties. If those for some reason are not set then we’re trying to retrieve the host name from the network interfaces.
If you have the discovery client enabled and prefer to retrieve the host address from the registered instance in a service registry then you have to set the property (it’s applicable for both HTTP and Stream based span reporting).
spring.zipkin.locator.discovery.enabled: true
By default if you add spring-cloud-starter-zipkin as a dependency to your project,
when the span is closed, it will be sent to Zipkin over HTTP. The communication
is asynchronous. You can configure the URL by setting the spring.zipkin.baseUrl
property as follows:
spring.zipkin.baseUrl: http://192.168.99.100:9411/
If you want to find Zipkin via service discovery it’s enough to pass the
Zipkin’s service id inside the URL (example for zipkinserver service id)
spring.zipkin.baseUrl: http://zipkinserver/ | Important |
|---|---|
The suggested approach is to use the Zipkin’s native support for message based span sending. Starting from Edgware Zipkin Stream server is deprecated and in Finchley it got removed. |
Please refer to the Dalston Documentaion on how to create a Stream Zipkin server.
If you’re wrapping your logic in Runnable or Callable it’s enough to wrap those classes in their Sleuth representative.
Example for Runnable:
Runnable runnable = new Runnable() {
	@Override
	public void run() {
		// do some work
	}

	@Override
	public String toString() {
		return "spanNameFromToStringMethod";
	}
};
// Manual `TraceRunnable` creation with explicit "calculateTax" Span name
Runnable traceRunnable = new TraceRunnable(tracer, spanNamer, errorParser,
		runnable, "calculateTax");
// Wrapping `Runnable` with `Tracing`. That way the current span will be available
// in the thread of `Runnable`
Runnable traceRunnableFromTracer = tracing.currentTraceContext().wrap(runnable);
Example for Callable:
Callable<String> callable = new Callable<String>() {
	@Override
	public String call() throws Exception {
		return someLogic();
	}

	@Override
	public String toString() {
		return "spanNameFromToStringMethod";
	}
};
// Manual `TraceCallable` creation with explicit "calculateTax" Span name
Callable<String> traceCallable = new TraceCallable<>(tracer, spanNamer, errorParser,
		callable, "calculateTax");
// Wrapping `Callable` with `Tracing`. That way the current span will be available
// in the thread of `Callable`
Callable<String> traceCallableFromTracer = tracing.currentTraceContext().wrap(callable);
That way you will ensure that a new Span is created and closed for each execution.
We’re registering a custom HystrixConcurrencyStrategy
that wraps all Callable instances into their Sleuth representative -
the TraceCallable. The strategy either starts or continues a span depending on the fact whether tracing was already going
on before the Hystrix command was called. To disable the custom Hystrix Concurrency Strategy set the spring.sleuth.hystrix.strategy.enabled to false.
Assuming that you have the following HystrixCommand:
HystrixCommand<String> hystrixCommand = new HystrixCommand<String>(setter) {
	@Override
	protected String run() throws Exception {
		return someLogic();
	}
};
In order to pass the tracing information you have to wrap the same logic in the Sleuth version of the HystrixCommand which is the
TraceCommand:
TraceCommand<String> traceCommand = new TraceCommand<String>(tracer, traceKeys, setter) {
	@Override
	public String doRun() throws Exception {
		return someLogic();
	}
};
We’re registering a custom RxJavaSchedulersHook
that wraps all Action0 instances into their Sleuth representative -
the TraceAction. The hook either starts or continues a span depending on the fact whether tracing was already going
on before the Action was scheduled. To disable the custom RxJavaSchedulersHook set the spring.sleuth.rxjava.schedulers.hook.enabled to false.
You can define a list of regular expressions for thread names, for which you don’t want a Span to be created. Just provide a comma separated list
of regular expressions in the spring.sleuth.rxjava.schedulers.ignoredthreads property.
Features from this section can be disabled by providing the spring.sleuth.web.enabled property with value equal to false.
Via the TraceFilter all sampled incoming requests result in creation of a Span. That Span’s name is http: + the path to which
the request was sent. E.g. if the request was sent to /foo/bar then the name will be http:/foo/bar. You can configure which URIs you would
like to skip via the spring.sleuth.web.skipPattern property. If you have ManagementServerProperties on classpath then
its value of contextPath gets appended to the provided skip pattern.
Since we want the span names to be precise we’re using a TraceHandlerInterceptor that either wraps an
existing HandlerInterceptor or is added directly to the list of existing HandlerInterceptors. The
TraceHandlerInterceptor adds a special request attribute to the given HttpServletRequest. If the
the TraceFilter doesn’t see this attribute set it will create a "fallback" span which is an additional
span created on the server side so that the trace is presented properly in the UI. Seeing that most likely
signifies that there is a missing instrumentation. In that case please file an issue in Spring Cloud Sleuth.
If your controller returns a Callable or a WebAsyncTask Spring Cloud Sleuth will continue the existing span instead of creating a new one.
Via the TraceWebFilter all sampled incoming requests result in creation of a Span. That Span’s name is http: + the path to which
the request was sent. E.g. if the request was sent to /foo/bar then the name will be http:/foo/bar. You can configure which URIs you would
like to skip via the spring.sleuth.web.skipPattern property. If you have ManagementServerProperties on classpath then
its value of contextPath gets appended to the provided skip pattern.
We’re injecting a RestTemplate interceptor that ensures that all the tracing information is passed to the requests. Each time a
call is made a new Span is created. It gets closed upon receiving the response. In order to block the synchronous RestTemplate features
just set spring.sleuth.web.client.enabled to false.
| Important |
|---|---|
You have to register |
| Important |
|---|---|
Starting with Sleuth |
To block the AsyncRestTemplate features set spring.sleuth.web.async.client.enabled to false.
To disable creation of the default TraceAsyncClientHttpRequestFactoryWrapper set spring.sleuth.web.async.client.factory.enabled
to false. If you don’t want to create AsyncRestClient at all set spring.sleuth.web.async.client.template.enabled to false.
Sometimes you need to use multiple implementations of Asynchronous Rest Template. In the following snippet you
can see an example of how to set up such a custom AsyncRestTemplate.
@Configuration
@EnableAutoConfiguration
static class Config {

	@Bean(name = "customAsyncRestTemplate")
	public AsyncRestTemplate traceAsyncRestTemplate() {
		return new AsyncRestTemplate(asyncClientFactory(), clientHttpRequestFactory());
	}

	private ClientHttpRequestFactory clientHttpRequestFactory() {
		ClientHttpRequestFactory clientHttpRequestFactory = new CustomClientHttpRequestFactory();
		//CUSTOMIZE HERE
		return clientHttpRequestFactory;
	}

	private AsyncClientHttpRequestFactory asyncClientFactory() {
		AsyncClientHttpRequestFactory factory = new CustomAsyncClientHttpRequestFactory();
		//CUSTOMIZE HERE
		return factory;
	}
}
We inject a ExchangeFilterFunction implementation that creates a span and via on success and on
error callbacks takes care of closing client side spans.
| Important |
|---|---|
You have to register |
If you’re using the Traverson library
it’s enough for you to inject a RestTemplate as a bean into your Traverson object. Since RestTemplate
is already intercepted, you will get full support of tracing in your client. Below you can find a pseudo code
of how to do that:
@Autowired RestTemplate restTemplate;

Traverson traverson = new Traverson(URI.create("http://some/address"),
    MediaType.APPLICATION_JSON, MediaType.APPLICATION_JSON_UTF8).setRestOperations(restTemplate);
// use Traverson
By default Spring Cloud Sleuth provides integration with feign via the TraceFeignClientAutoConfiguration. You can disable it entirely
by setting spring.sleuth.feign.enabled to false. If you do so then no Feign related instrumentation will take place.
Part of Feign instrumentation is done via a FeignBeanPostProcessor. You can disable it by providing the spring.sleuth.feign.processor.enabled equal to false.
If you set it like this then Spring Cloud Sleuth will not instrument any of your custom Feign components. All the default instrumentation
however will be still there.
In Spring Cloud Sleuth we’re instrumenting async related components so that the tracing information is passed between threads.
You can disable this behaviour by setting the value of spring.sleuth.async.enabled to false.
If you annotate your method with @Async then we’ll automatically create a new Span with the following characteristics:
- if the method is annotated with
@SpanNamethen the value of the annotation will be the Span’s name - if the method is not annotated with
@SpanNamethe Span name will be the annotated method name - the Span will be tagged with that method’s class name and the method name too
In Spring Cloud Sleuth we’re instrumenting scheduled method execution so that the tracing information is passed between threads. You can disable this behaviour
by setting the value of spring.sleuth.scheduled.enabled to false.
If you annotate your method with @Scheduled then we’ll automatically create a new Span with the following characteristics:
- the Span name will be the annotated method name
- the Span will be tagged with that method’s class name and the method name too
If you want to skip Span creation for some @Scheduled annotated classes you can set the
spring.sleuth.scheduled.skipPattern with a regular expression that will match the fully qualified name of the
@Scheduled annotated class.
| Tip |
|---|---|
If you are using |
We’re providing LazyTraceExecutor, TraceableExecutorService and TraceableScheduledExecutorService. Those implementations
are creating Spans each time a new task is submitted, invoked or scheduled.
Here you can see an example of how to pass tracing information with TraceableExecutorService when working with CompletableFuture:
CompletableFuture<Long> completableFuture = CompletableFuture.supplyAsync(() -> {
	// perform some logic
	return 1_000_000L;
}, new TraceableExecutorService(beanFactory, executorService,
		// 'calculateTax' explicitly names the span - this param is optional
"calculateTax")); | Important |
|---|---|
Sleuth doesn’t work with |
Sometimes you need to set up a custom instance of the AsyncExecutor. In the following snippet you
can see an example of how to set up such a custom Executor.
@Configuration
@EnableAutoConfiguration
@EnableAsync
static class CustomExecutorConfig extends AsyncConfigurerSupport {

	@Autowired BeanFactory beanFactory;

	@Override public Executor getAsyncExecutor() {
		ThreadPoolTaskExecutor executor = new ThreadPoolTaskExecutor();
		// CUSTOMIZE HERE
		executor.setCorePoolSize(7);
		executor.setMaxPoolSize(42);
		executor.setQueueCapacity(11);
		executor.setThreadNamePrefix("MyExecutor-");
		// DON'T FORGET TO INITIALIZE
		executor.initialize();
		return new LazyTraceExecutor(this.beanFactory, executor);
	}
}
Spring Cloud Sleuth integrates with Spring Integration. It creates spans for publish and
subscribe events. To disable Spring Integration instrumentation, set spring.sleuth.integration.enabled to false.
You can provide the spring.sleuth.integration.patterns pattern to explicitly
provide the names of channels that you want to include for tracing. By default all channels
are included.
| Important |
|---|---|
When using the |
You can find the running examples deployed in the Pivotal Web Services. Check them out in the following links: